Learn the market's plumbing.
Plain-language lessons on how trading works, where liquidity sits, and how to read support and resistance, order blocks, fair value gaps and volume profile.
 STARTER LAB
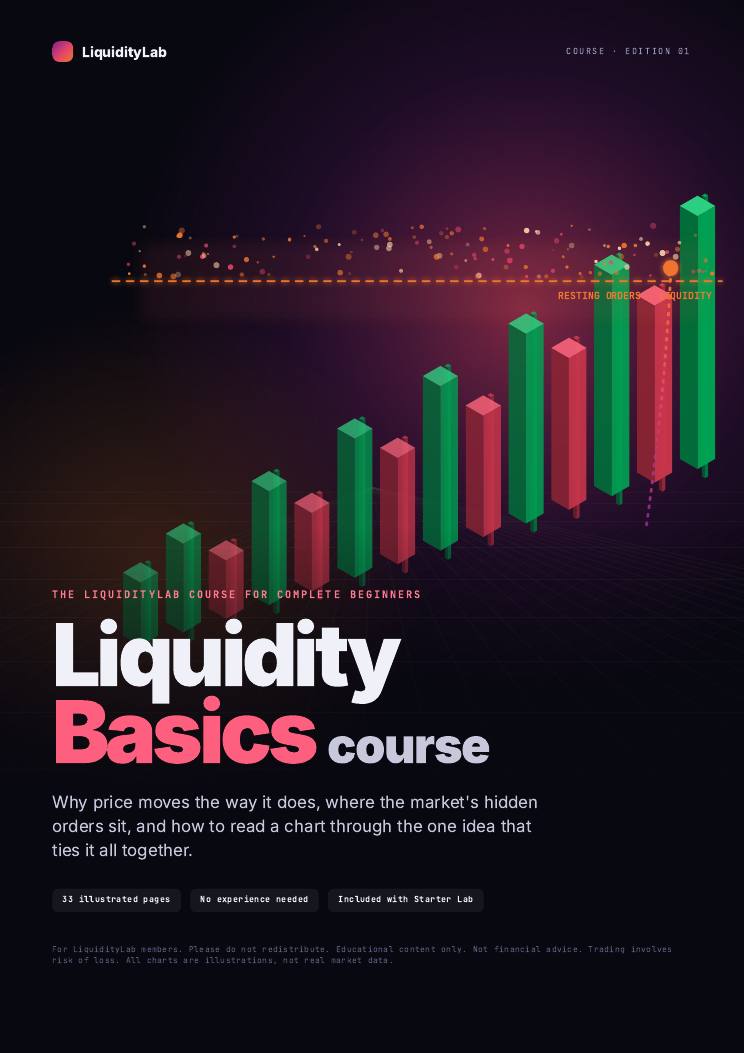
Go deeper with the Liquidity Basics course.
Everything on this free desk, expanded into 33 illustrated pages: order books, sweeps, FVGs, order blocks and a full worked example. Yours for life with Starter Lab, a one-time $149.
What is trading?
Trading is buying and selling a market to profit from changes in its price. Every price you see is simply the last place a buyer and a seller agreed.
The bid is the best price someone will pay right now, the ask is the best price someone will sell at, and the gap between them is the spread. Going long means you profit if price rises; going short means you profit if it falls.
Charts usually show price as candles. Each candle covers one period, like five minutes or one day, and shows four prices: where it opened, the highest and lowest it traded, and where it closed.
Liquidity
Liquidity is how easily a market can be traded without moving the price much. In practice, it means resting orders: limit orders waiting to be filled, and stop orders waiting to be triggered.
Those orders cluster at obvious places. Above a run of equal highs sit the stops of everyone who is short, plus the buy orders of breakout traders. That is buy-side liquidity. Below equal lows sits sell-side liquidity.
Large orders need a lot of opposing orders to fill against, so price is often drawn toward these pools. When price trades through a pool and quickly reverses, it is called a liquidity sweep or stop run.
Support and resistance
Support is a price area where buying has repeatedly stepped in and stopped a fall. Resistance is an area where selling has repeatedly stopped a rise.
Treat them as zones, not exact lines. A level matters more when it has been tested several times, when it is visible on higher timeframes, and when price left it with force.
When resistance finally breaks and price holds above it, the old resistance often becomes new support. This is called a role reversal. A break that fails to hold and falls straight back is a fakeout, and the stops it triggered are liquidity.
Order blocks (OB)
An order block is the last opposing candle before a strong move that breaks market structure. In a bullish case, it is the last down candle before an impulsive rally.
The idea is that large orders were placed in that candle, and not all of them were filled. When price returns to the zone, the remaining orders can make it react. That return is often called mitigation or a retest.
Not every last candle is an order block. The useful ones caused displacement, a fast move that left imbalance behind, and broke a prior swing.
Fair value gaps (FVG)
A fair value gap is a three-candle pattern where the middle candle moves so fast that the first and third candles do not overlap. In a bullish gap, the high of candle one sits below the low of candle three.
The space between them traded in only one direction, so it is often called an imbalance. Price frequently comes back to rebalance it, filling part or all of the gap before continuing.
Many traders watch the midpoint of the gap, sometimes called consequent encroachment, as the level where a reaction is most likely.
Volume profile (VP)
A normal volume bar shows how much traded in each time period. A volume profile turns that sideways and shows how much traded at each price level over a chosen period.
Wide areas are high volume nodes: prices the market accepted and spent time at. Thin areas are low volume nodes: prices the market moved through quickly, which it often moves through quickly again.
The value area is the range where about 70% of the volume traded. Its top and bottom are the value area high (VAH) and value area low (VAL).
Point of control (POC)
The point of control is the single price level with the most volume in the profile. It is where the market agreed on price for the longest.
Because so much business was done there, price often returns to it, and it can act as a magnet in a range or as support or resistance once price leaves it.
A POC that price has not revisited since it formed is often called a naked POC. Traders watch these as possible targets.
Risk first
No setup works every time, so the size of each loss decides whether you stay in the game. Many traders cap the risk on a single trade at a small, fixed share of the account.
Set the invalidation first: the price where the idea is wrong. Place the stop there, then size the position so that hitting it costs your fixed amount. The free position size calculator does that maths for you.
Losses compound against you: after a 50% drawdown you need a 100% gain just to get back to even.
Every term on one page.
Aggressive orders hitting a level without moving it, because resting orders soak them up.
Price holding beyond a level, usually with closes and a successful retest.
The lowest price a seller is currently willing to accept.
The highest price a buyer is currently willing to pay.
Break of structure: price breaks a prior swing in the direction of the trend.
Resting buy orders and short sellers' stops above highs.
Change of character: the first break of structure against the prior trend.
The midpoint of a fair value gap.
Buying volume minus selling volume for a bar.
A fast, one-sided move that leaves imbalance behind.
The fall from an account peak to a later low.
Fair value gap: a three-candle imbalance where candles one and three do not overlap.
The price where a trade idea is proven wrong.
Controlling a larger position than your deposit. Multiplies gains and losses.
Price trading through a pool of resting orders, then reversing.
Market structure shift: a decisive break of structure after a sweep.
The last opposing candle before a structure-breaking move.
Optimal trade entry: a retracement zone, commonly 62% to 79% of a leg.
Point of control: the price with the most traded volume in a profile.
Result of a trade measured in units of the amount risked.
Resting sell orders and long traders' stops below lows.
The gap between the bid and the ask.
The price range holding about 70% of a profile's volume.
Volume weighted average price for the session.
No term matches that search.